顏士清 助理教授
國立清華大學通識教育中心暨生命科學系
Shih-Ching Yen, Assistant Professor
Center for Gerneal Education and Department of Life Science, Notional Tsing Hua University
陽明山國家公園的流浪狗與野生動物

圖片來源(scientific reports 2019)
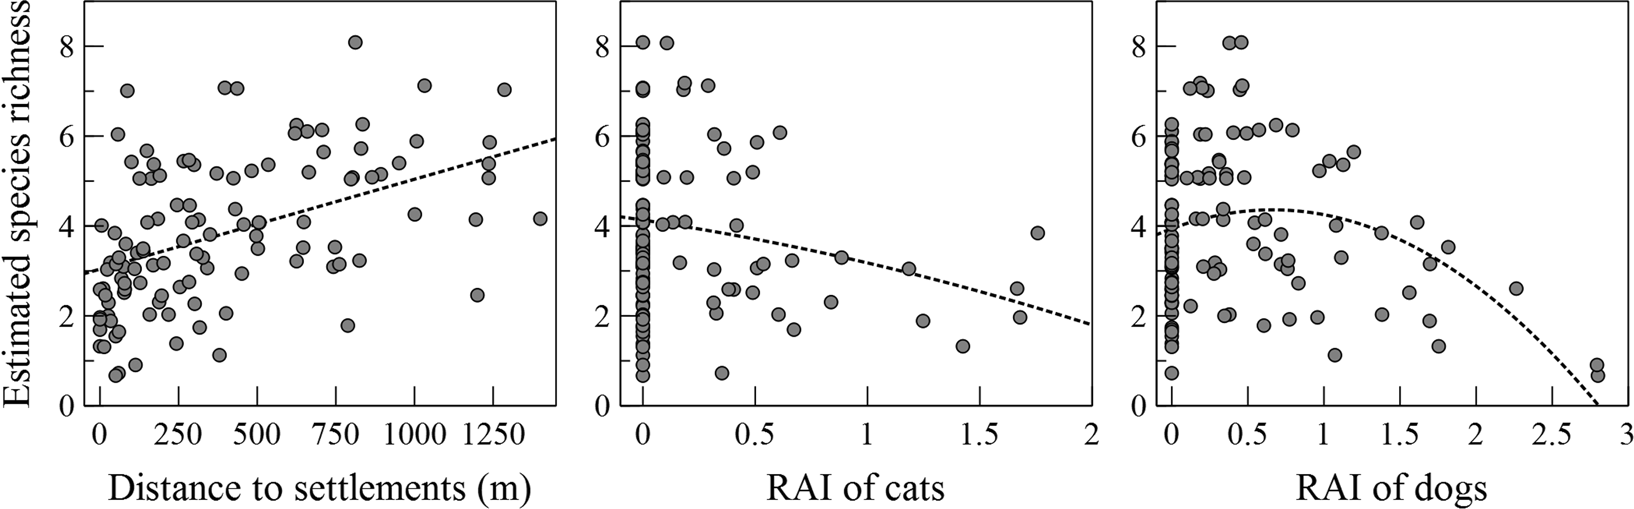
壽山國家公園的流浪狗與野生動物
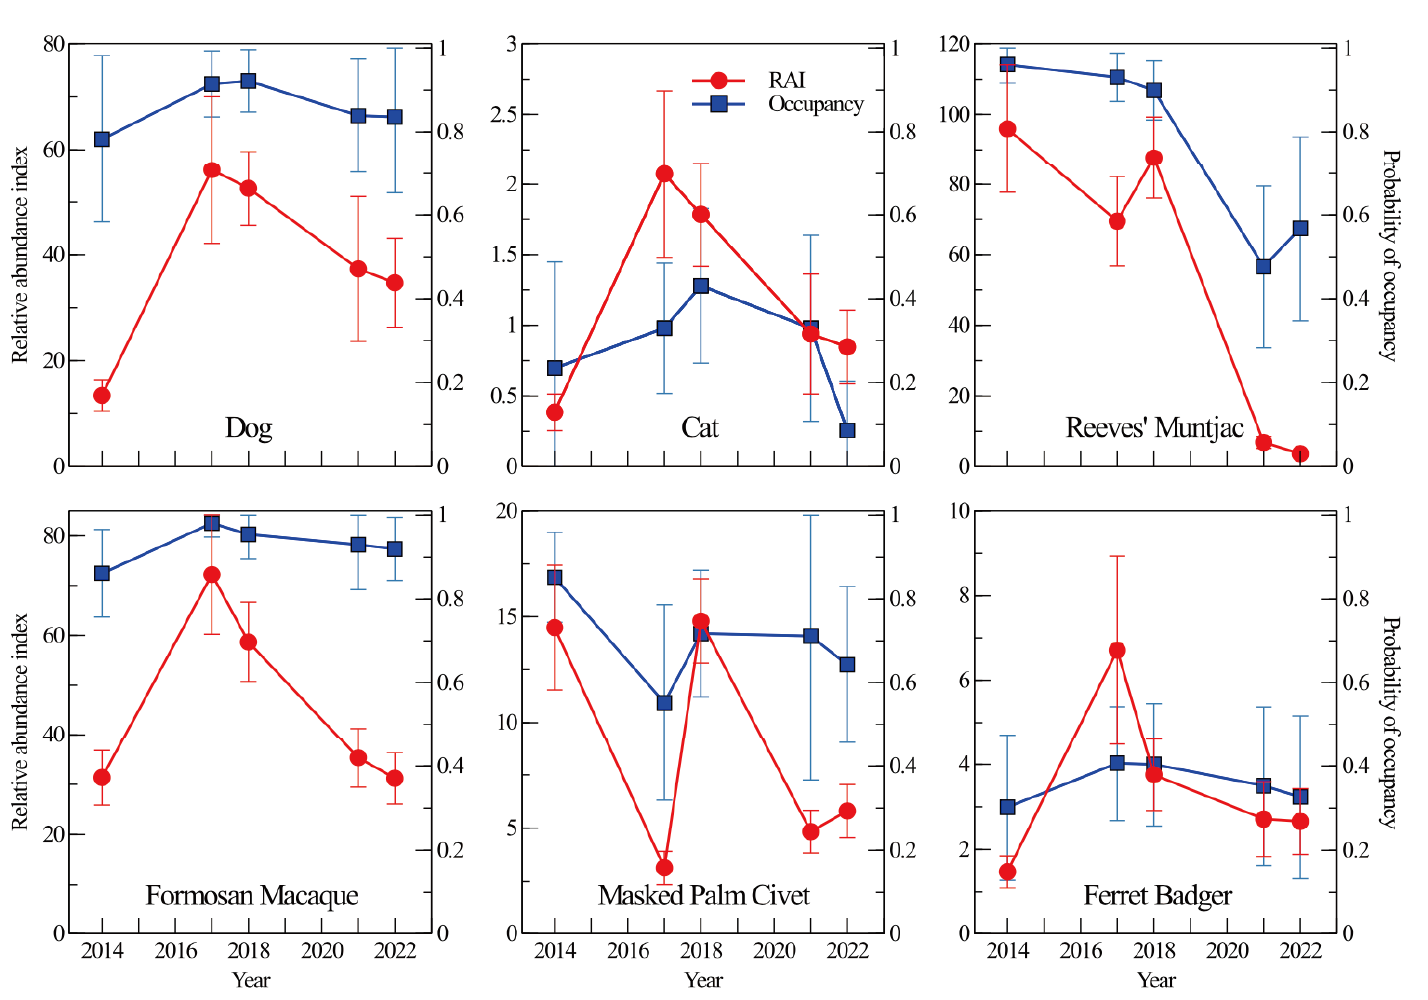
平均每100天拍到的目標物種照片量
目標物種在取樣範圍所佔據的比例或出線的機率
| 狗 | 從2014年到2017年顯著增加(+318%, p=0.004),之後略為下降(-29%, p=0.021),但2022年的狗的RAI和佔據率仍高於2014年。 | ||
| 貓 | 趨勢與狗相似,不過貓的指標數值無顯著變化,且一直保持非常低。 |
| Dog | Increased significantly from 2014 to 2017 (+318%, p =0.004), followed by a marginal decline after(-29%, p =0.021). The dog’s RAI and occupancy in 2022 was still higher than that in 2014. | ||
| Cat | Exhibited a similar trend to dogs. However, the indicator values for cats did not differ significantly and were consistently very low. |
| 山羌 | 2014年有最高的RAI和占據率,在2018年至2021年期間,RAI下降超過90%(p < 0.001) | ||
| 果子狸 | 從2014年至2022年經歷了一些波動,2022年RAI (-60%, p =0.009)和占據率(-25%)略有下降 | ||
| 台灣獼猴 | 2014年和2022年的指標相似 | ||
| 鼬獾 | 2014年和2022年的指標相似 |
| Reeves' muntjacs | The highest RAI and highest occupancy were in 2014. RAI declined over 90% (p < 0.001) between 2018 and 2021. |
| Masked palm civets | Experienced some fluctuations from 2014 to 2022, RAI (-60%, p =0.009) and the occupancy(-25%) decreased marginally in 2022. |
| Formosan macaques | Indicators were similar in 2014 and in 2022. |
| Ferret badgers | Indicators were similar in 2014 and in 2022. |
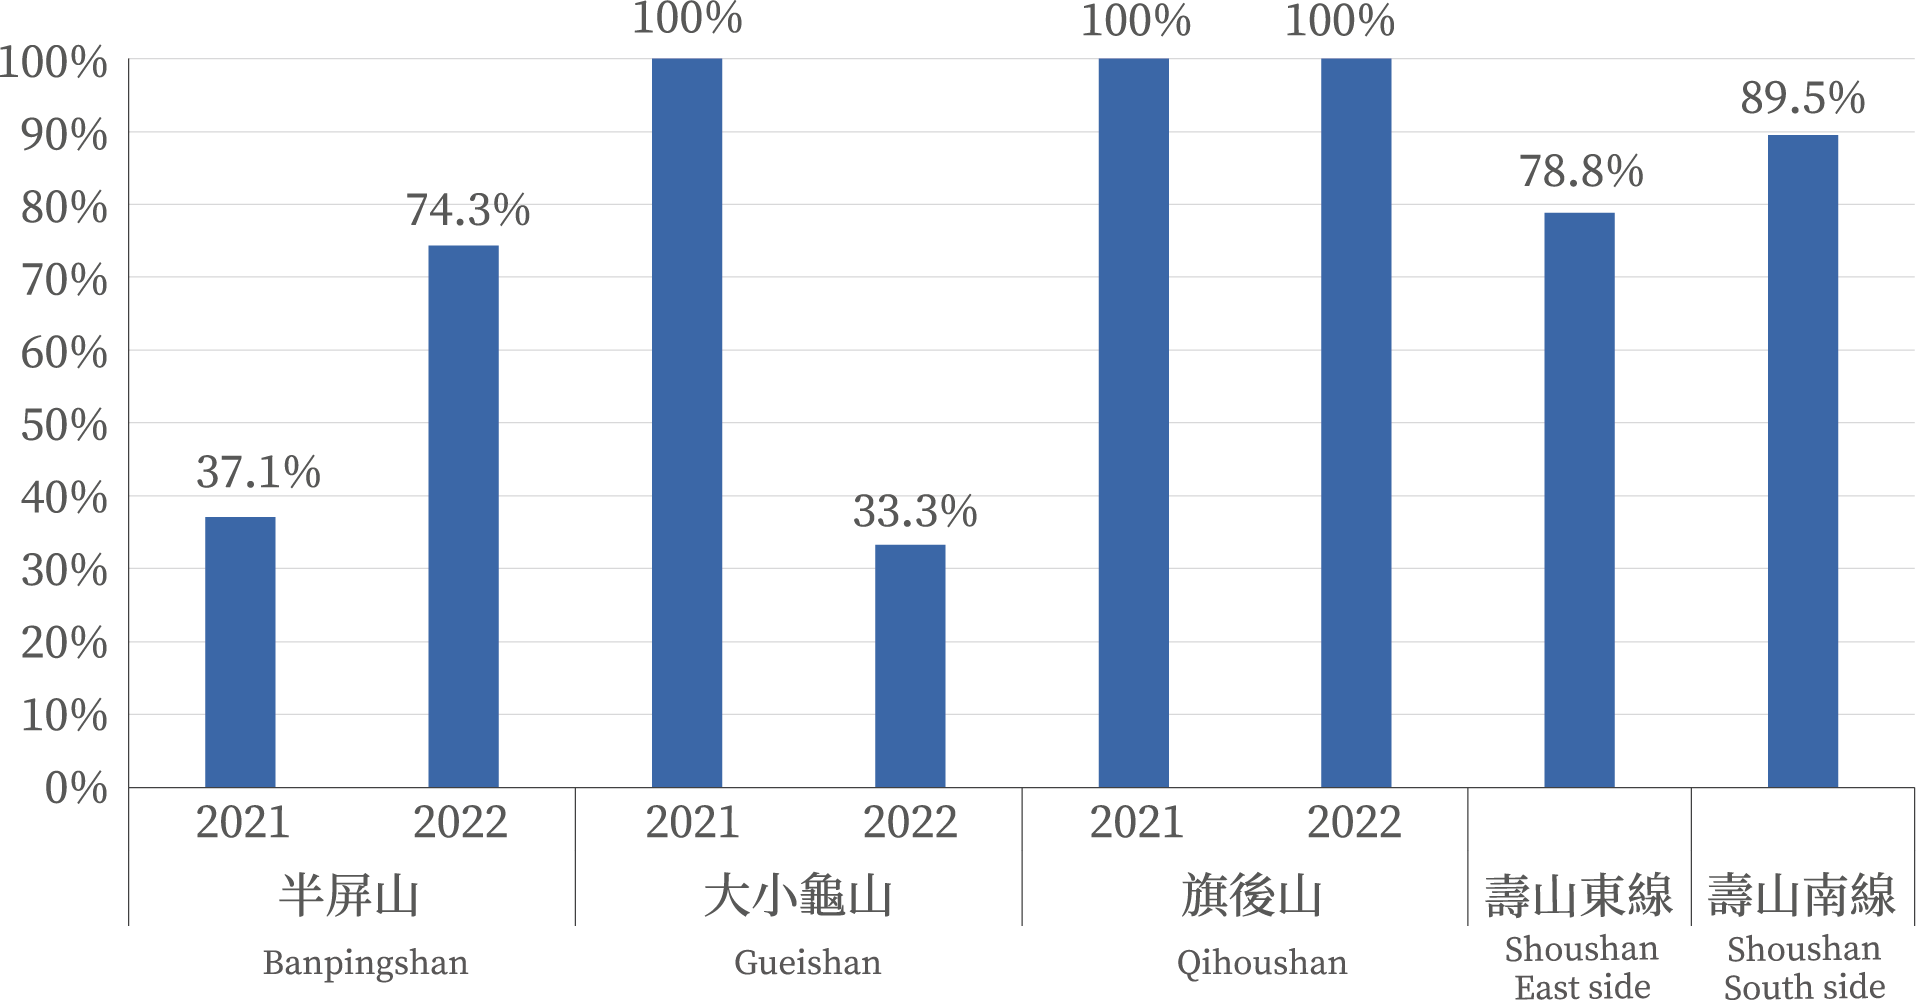
估計數量612隻,95%信賴區間419-806隻。
隨機遭遇模式
估計犬隻數量427隻,95%信賴區間411-444隻。
Random encounter model
Estimated population: 612 individuals, with a 95% confidence interval of 419 to 806 individuals.
Distance sampling with camera traps
Estimated population: 427 individuals, with a 95% confidence interval of 411 to 444 individuals.
數量為密度乘上樣區面積 (壽山區面積9.287 km2)。
因犬隻可移動至樣區外,數量可能低估。
The population is calculated by multiplying density by the sample area (Shoushan area: 9.287 km²).
Since dogs can move outside the sample area, the population size may be underestimated.
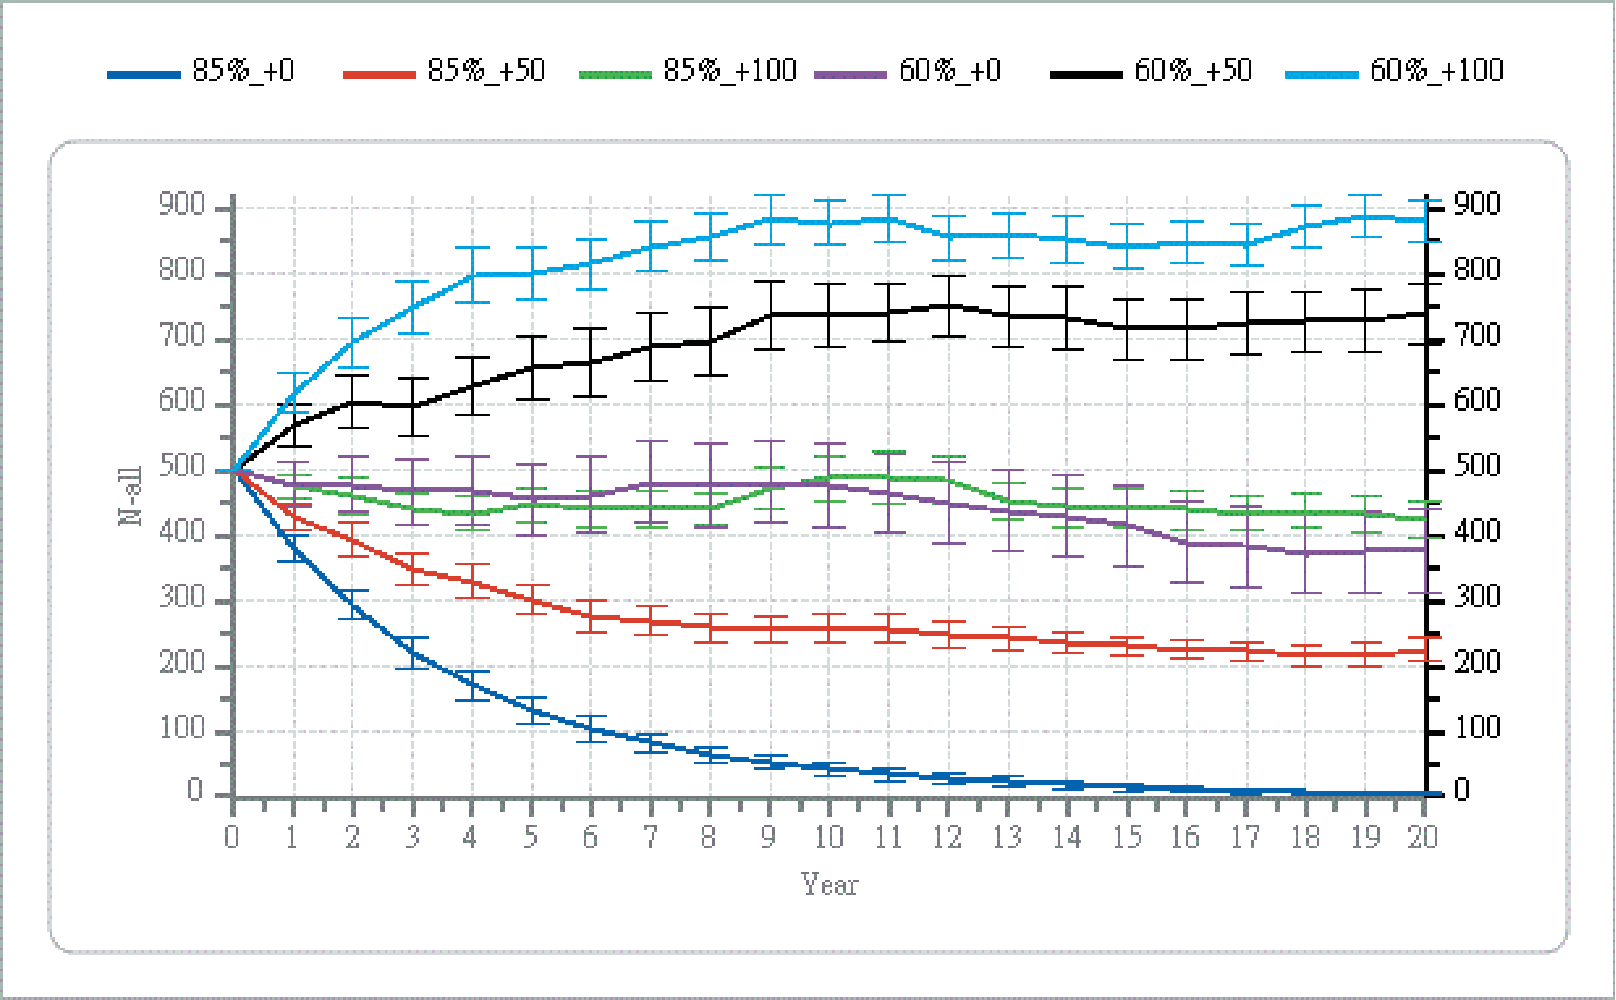
| 理想狀況 | 絕育率長年維持在85%,且完全沒有外來犬隻進入本區(藍線),估計10年後數量下降90%。 | ||
| 現實狀況 | 時常有新個體進入本區(紅線代表每年50隻,綠線代表每年100隻),估計數量控制效果不佳。 |
Ideal Scenario: If the sterilization rate remains at 85% consistently and no new dogs enter the area (blue line), the population will decrease by 90% in 10 years.
Real world Scenario: With new individuals frequently entering the area (red line represents 50 new dogs per year, and green line represents 100 new dogs per year), the population control effect will be poor.
陽明山國家公園的流浪狗與野生動物
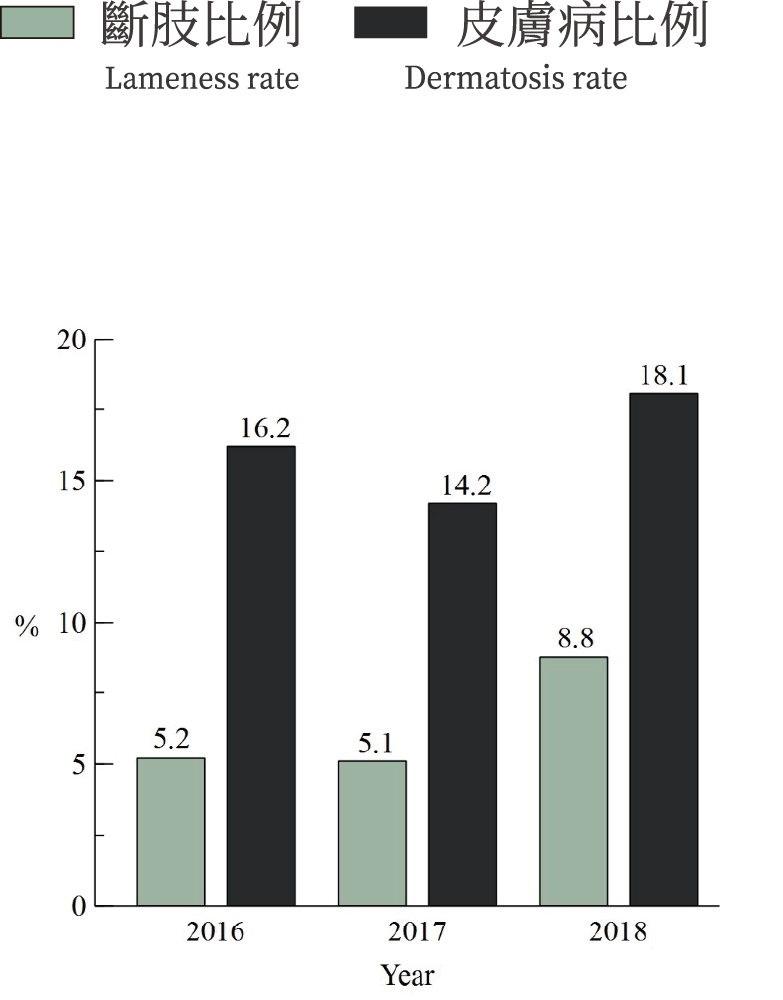
35份遊蕩犬血液樣本顯示
貧血:34%
白血球指數異常:37%
血小板指數異常:69%
35 blood samples from free-roaming dogs showed
anemia:34%
Abnormal WBC count:37%
Abnormal platelets count:69%

圖片來源(Preventive Veterinary Medicine)

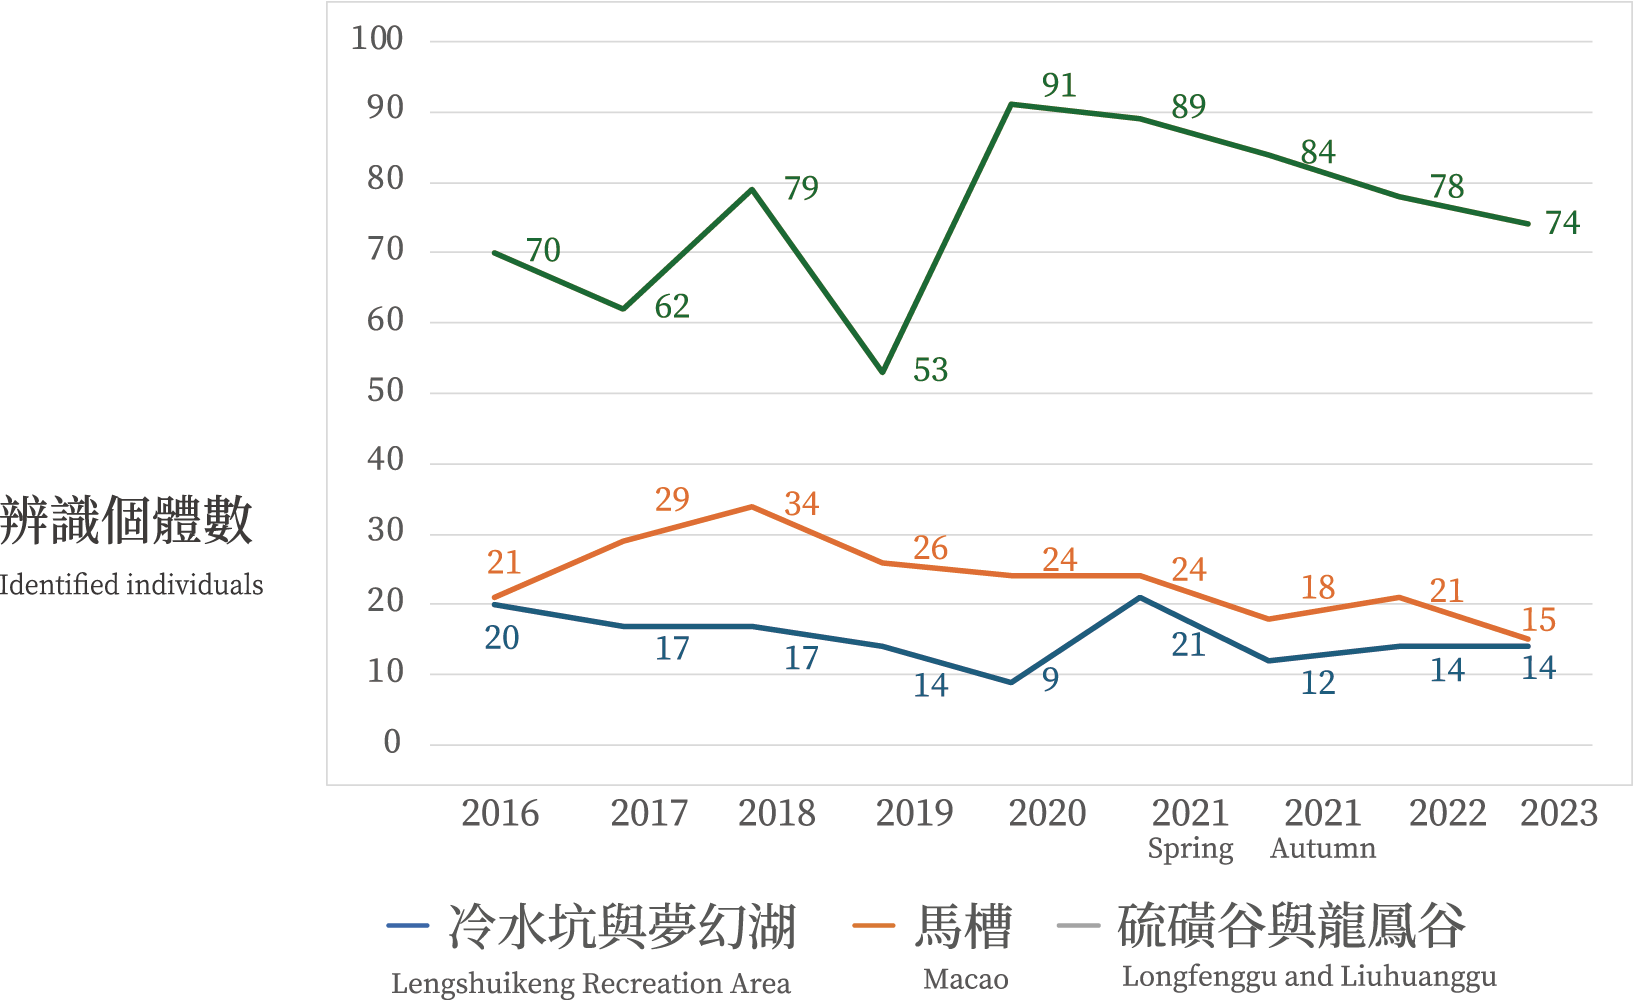
留存率不高的情況下,數量卻沒有明顯變化,表示不斷的有新犬移入、幼犬出生
Despite the low suvivorship, the population size has not changed significantly, indicating a continuous influx of new dogs and the birth of puppies.
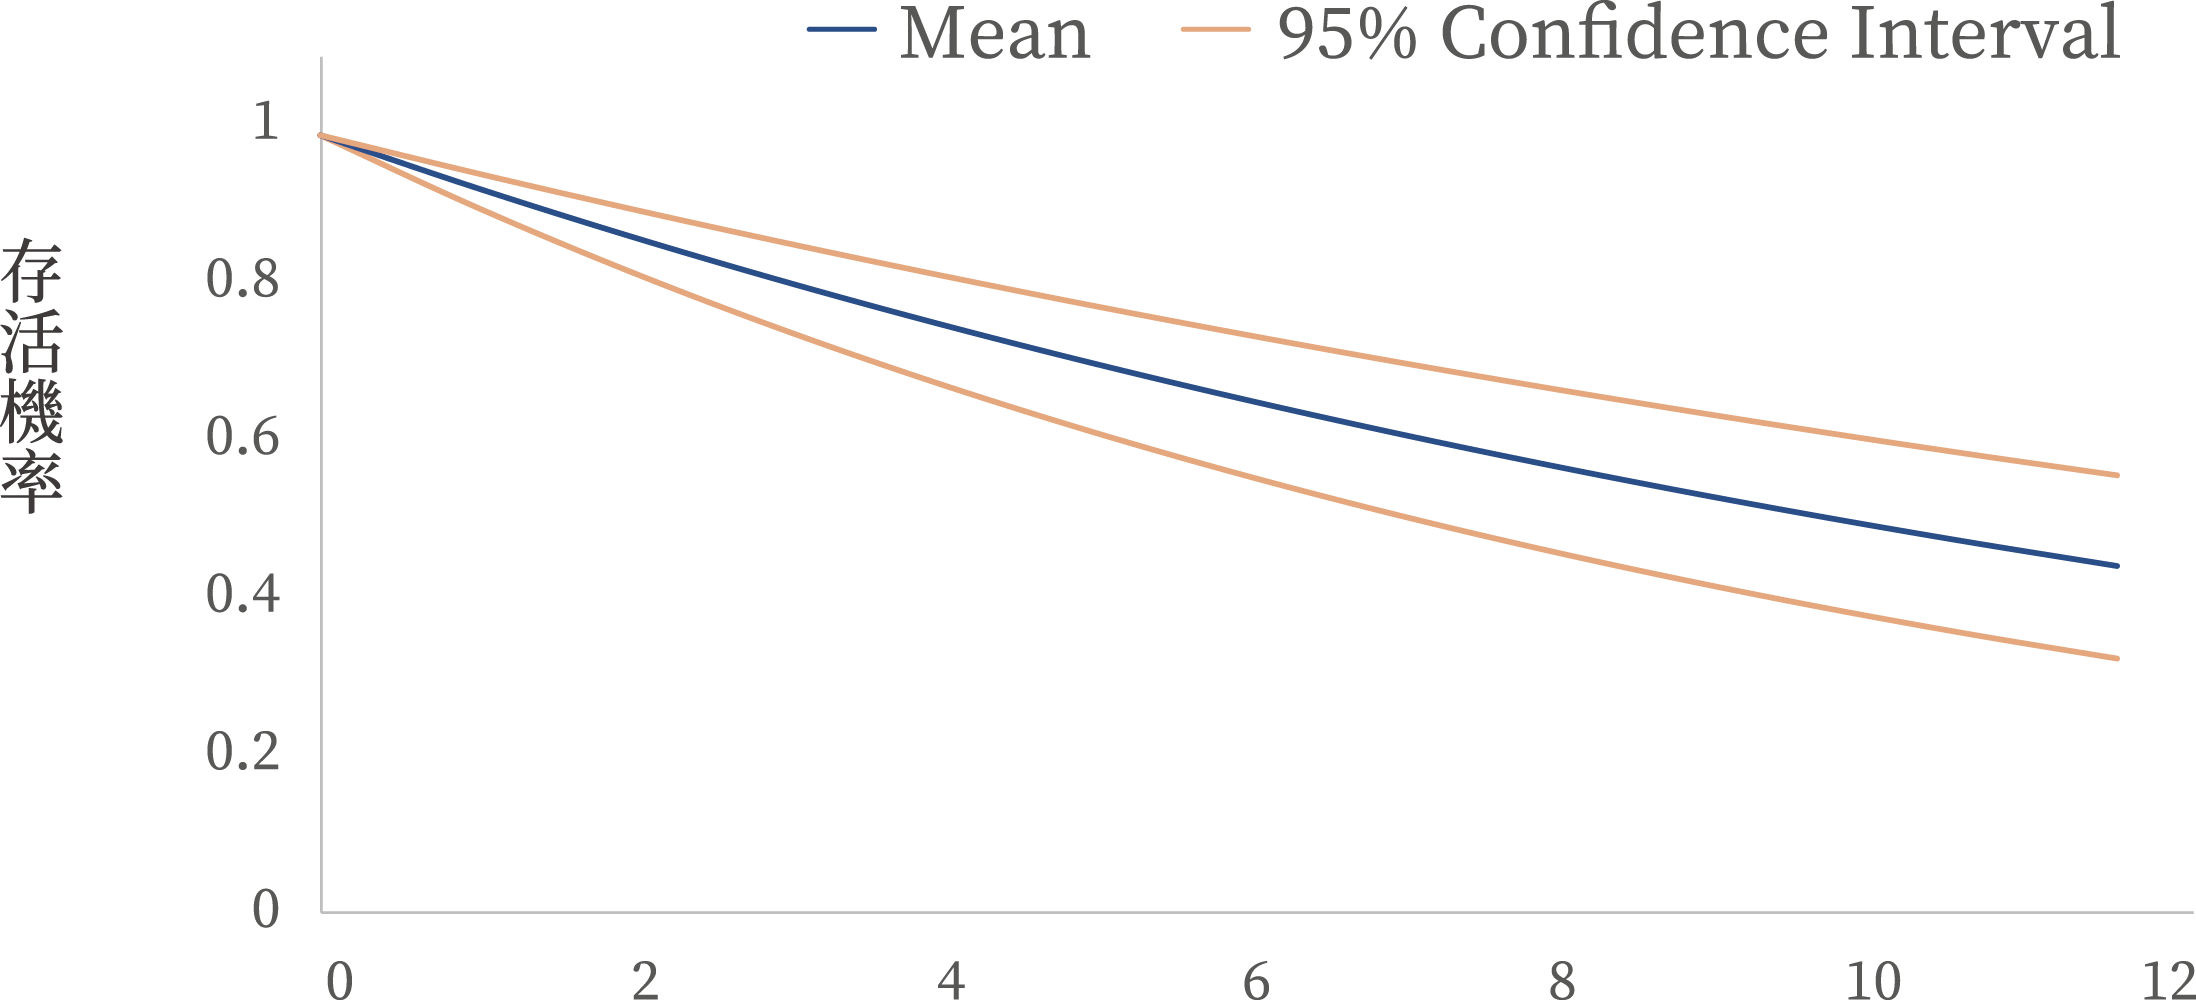
雖然無法確認所有消失個體都已經死亡,但基於健康狀況不佳的比例很高,推測消失個體有不少應該已經死亡
Although we cannot be sure that all the missing individuals have died, the poor health conditions suggest that many of them are likely deceased.
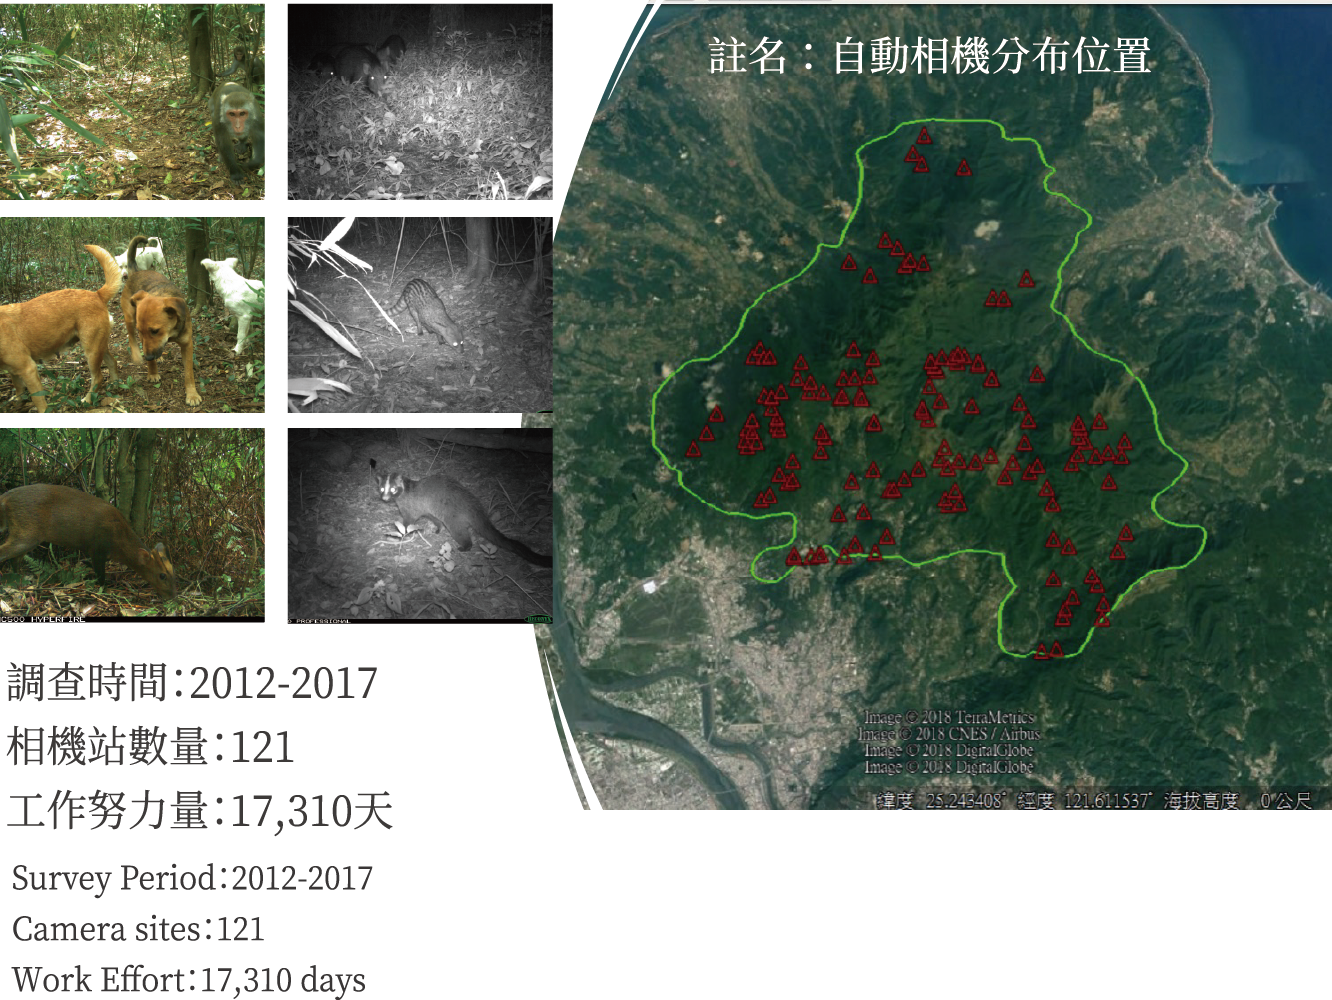
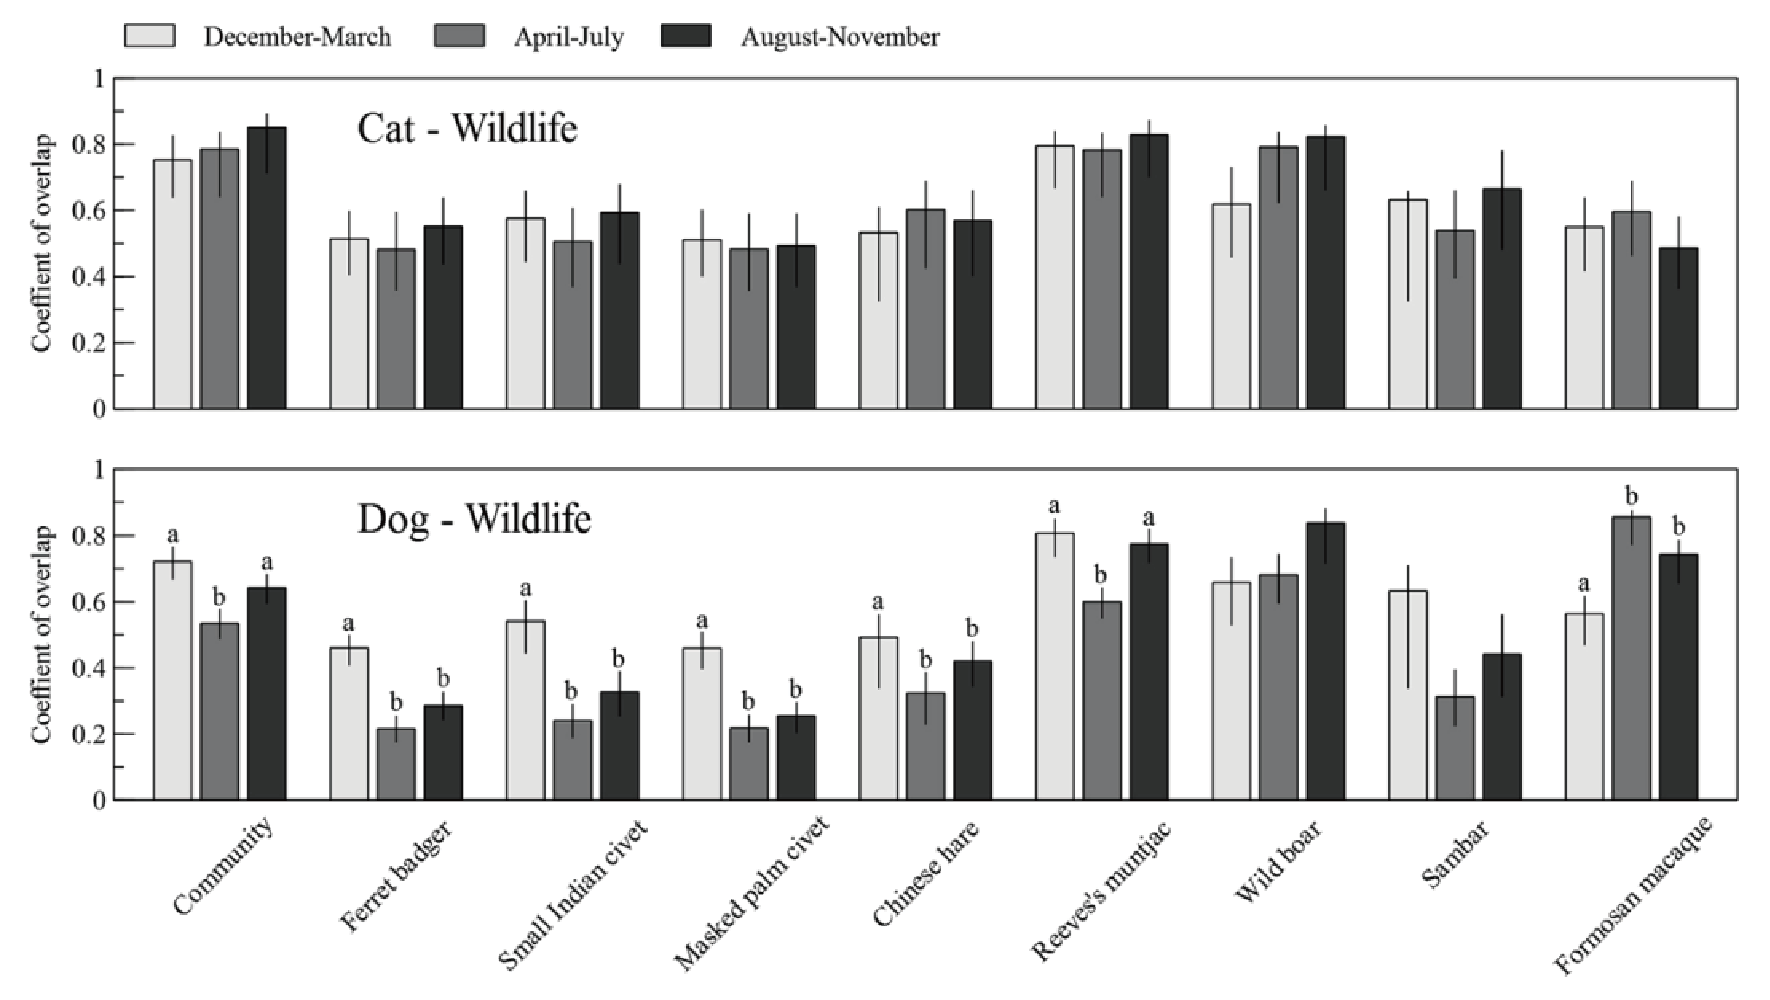

圖片來源(scientific reports 2019)
